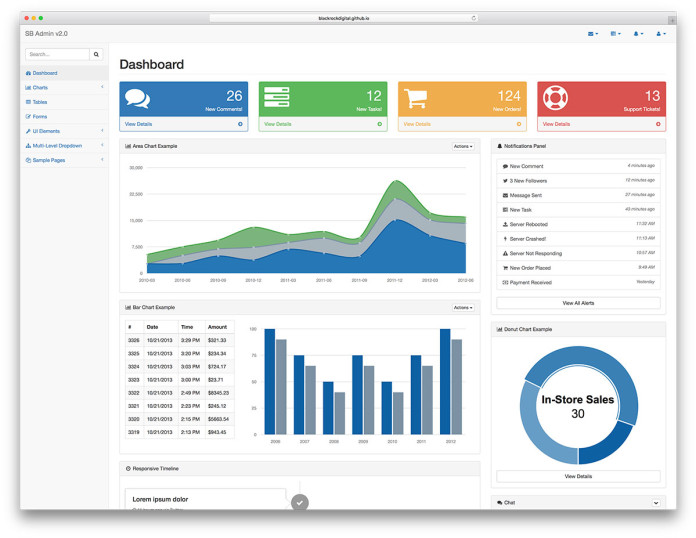
A Dashboard is a visual presentation of current summary information needed to manage and guide an organization or activity. A dashboard is the main surface area that a worker can engage with to understand the current status of the work.
Data Visualization is about supplying organizations with evidence
A Dashboard should be designed to drive organizational coherence through a shared understanding of the organizational position, performance, flows, and influencers.
Dashboards must have the following to provide value:
- Relevant: Know your audience, and consider your data. There are two primary flavors depending on the audience. Executive Management Summary and Operational dashboards. The value of the data is exponentially useful correlated to its usage. It is of no value to produce a dashboard that will never be used. Operational dashboards, in the most granular sense, are either at the team level or/and individual level, which makes them relevant to managers or team members. These dashboards let the audience knows what is cared about, is being measured, and always show the score relative to the goal. These will make up the widgets on your dashboard and are called Key Performance Indicators (KPIs)
egNumber of Breached Items: 10 / 20 = 50.00 %
- Accessible: Determine the best visualization. Users must be readily observable and tell in less than 5 seconds if the work is on schedule or behind. Have the dashboards online or in the natural line of sight so workers can know if they are winning or losing. It must be easy to understand. Infographics and a pleasing user interface can help make the data accessible as they visualize and clarify the text.
eg
Number of Breached Items: 5 / 20 = 25.00 %
- Actionable: Revise and enhance to clarify. If the status is in a losing state, the worker must know what actions can be taken to change it and transition it to green winning status. Workers can only act on lead measures to impact lagging measures. If the KPI is a lagging indicator, it is too late to act.
eg
Income this Quarter: -$5, 000
- Auditable: If the reporting is not the System of Input or System of Record, the data must have lineage to the source and reflect any alterations along the way to that feature data. The dashboard must be trusted and, indeed, accurate.
What should you read next?


