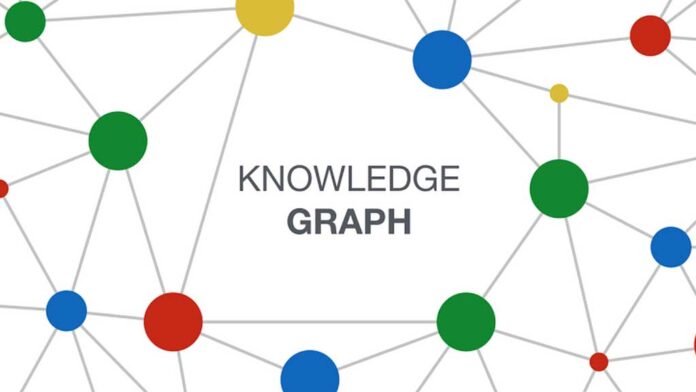
A knowledge graph helps a company gain insights from disparate data sources by organizing and linking structured and unstructured data into a unified, semantically enriched framework. This enables businesses to derive meaningful connections, patterns, and actionable insights that are otherwise difficult to uncover when data is siloed or unconnected. Here’s how it achieves this:
1. Integration of Disparate Data Sources
- Unified Data Representation:
- Knowledge graphs integrate data from multiple systems, databases, and formats (e.g., relational databases, IoT sensors, text documents) into a single, connected graph structure.
- This breaks down silos and creates a holistic view of the data landscape.
- Example: Combining data from CRM systems, financial reports, and supply chain logs to create a comprehensive view of customer interactions and business operations.
2. Semantic Context and Enrichment
- Data Understanding:
- Knowledge graphs use ontologies, taxonomies, and semantic models to provide context and meaning to data. This helps in understanding relationships between entities and attributes.
- Example: Connecting a “customer” entity to their purchases, demographics, and support interactions in a way that captures the semantics of these relationships.
- Enriched Relationships:
- The graph highlights relationships between data points, such as dependencies, hierarchies, or causation, which are hard to detect in traditional tabular data.
3. Query Across Connected Data
- Advanced Querying:
- Knowledge graphs allow querying across diverse data sources using graph-specific query languages like SPARQL or Cypher.
- These queries enable deeper insights that traditional SQL queries struggle to achieve due to their linear and relational structure.
- Example: A query can find “all customers who purchased Product A and submitted a support ticket within the last month,” even if this data resides in separate systems.
4. Pattern and Anomaly Detection
- Relationship-Centric Analysis:
- The graph structure makes it easier to detect patterns or anomalies based on relationships.
- Example: Identifying a fraudulent transaction by analyzing unusual connections between accounts, transactions, and locations.
- Visual Exploration:
- Graph visualization tools enable users to explore complex relationships interactively, leading to insights that might not emerge from tables or dashboards.
5. Data Discovery and Enhanced Search
- Entity Search:
- Knowledge graphs power semantic search, enabling users to discover relevant data based on context and relationships rather than exact keyword matches.
- Example: A search for “suppliers in Asia with late deliveries” can find results based on linked data from supply chain logs, regional records, and shipping schedules.
- Faceted Navigation:
- Users can explore data through facets (e.g., categories, properties) without needing to know the underlying schema or data location.
6. Improved Decision-Making with Contextual Insights
- Actionable Insights:
- By connecting disparate data points, knowledge graphs reveal hidden opportunities, inefficiencies, or risks.
- Example: Identifying high-value customers at risk of churn by linking transactional history, customer support interactions, and social media sentiment.
- Scenario Simulation:
- Graphs can model scenarios and their implications by simulating changes in one part of the graph and analyzing their ripple effects.
7. Real-Time Insights
- Dynamic Updates:
- Knowledge graphs can ingest streaming data, allowing for real-time updates and insights as new data flows in.
- Example: Continuously updating a supply chain graph with IoT data from sensors to monitor inventory levels and shipment delays in real-time.
8. Supporting AI and Machine Learning
- Feature Engineering:
- Knowledge graphs provide structured, meaningful relationships that can be used as features in machine learning models.
- Example: Using graph embeddings to predict customer behavior or recommend products.
- Explainability:
- Graphs improve the interpretability of AI models by clearly showing the relationships and data used for decision-making.
- Knowledge-Based Recommendations:
- Power intelligent recommendation systems by understanding user preferences, behavior, and contextual relationships.
9. Enhanced Collaboration
- Shared Understanding:
- Knowledge graphs provide a shared visual representation of data that is easier for both technical and non-technical stakeholders to understand.
- Example: Teams from sales, marketing, and customer service can collaborate using the same graph to identify customer pain points and improve engagement.
10. Scalability and Flexibility
- Dynamic Schema:
- Unlike traditional relational databases, knowledge graphs are schema-optional and can evolve as new data and relationships emerge.
- Example: Adding new data sources or entities, such as social media metrics, without needing major changes to the existing structure.
- Cross-Domain Insights:
- Knowledge graphs allow linking unrelated domains (e.g., HR and operations) to find insights that would be difficult in isolated systems.
Example Use Case: Supply Chain Optimization
- A company uses a knowledge graph to link data from IoT sensors, inventory systems, shipping providers, and customer orders. By querying the graph, they identify bottlenecks, predict delivery delays, and optimize routes dynamically, improving overall efficiency and customer satisfaction.
Conclusion
A knowledge graph helps organizations transform disparate data sources into a connected ecosystem of meaningful relationships. This enables advanced querying, pattern detection, and contextual understanding and drives better decision-making, real-time insights, and operational efficiency. Its flexibility and evolving ability make it a powerful tool for extracting value from complex and siloed data landscapes.


