We have not added much commentary to our reporting from the MIS (management information system) in the 80’s.
What progress have we made over the years?
1990’s – We have made reports web enabled. There are 2 advantages in this format, it is sharable using one trusted source and not many copies of the data or forwarded information. The second is the ability to use links. These links also enabled the drill down of information online, this was previously done using filters in excel type files. These drill paths are now predefined for the end user. We also have the ability to link to other presentations in the same content of where were left off in the previous report.
“There is an every growing need for people who can interpret the numbers, comments and network the right people together to discuss the findings.”
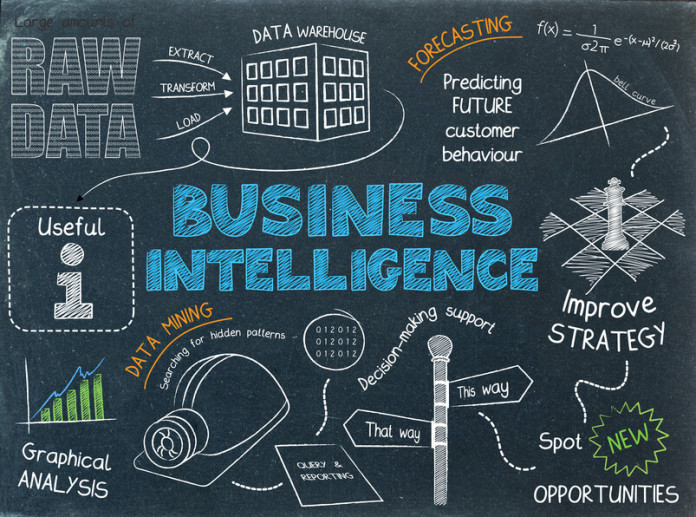
2000’s – Dashboard, Actionable Items and Collaboration took up most of our efforts. Dashboard have provided a quick fix to the long time issue of all Data warehouses, that is data integration. In the traditional warehouse we must ETL (Extract, Transform and Load) the data and sometimes this is a considerable effort to get the data at the same grain or quality or keys. The dashboard can still remain in stove pipes information architecture wise but display to the user sensible nuggets. This would behave like a bag of pop corn where users can can dive in anywhere and still get a morsel to chew on.
We segmented the audience to line workers or consumers, middle management and executives. We have put all the information at the context of the user who is now logged in and accessing the information. This still does not foster best practices, especially as we move toward the executive level. Knowledge does not live in documents and we need to translate these findings to the best minds to filter into consideration the current work flow and its impacts. We also need to prioritize the actions in order to address the issues or findings. We have been dash-boarding for years now. The first dashboard was called “print which make up news papers or magazines”. These are the formats that general consumers needs to digest the BIG Data and collaborate. There is an every growing need for people who can interpret the numbers, comments and network the right people together to discuss the findings.
Our notion of action enabled dashboards are still tuned to data mining and root cause analysis. We have alerts which are great for pacing the organization from falling behind the intended speed set but this still has to translate to innovative action to get to the organization to the set destination. Is Mobile BI the answer to Business Intelligence. What we do know is that the expansion of consuming devices is only making the environment more complex. Real time data in combination with Mobile might be the deadly duo to able to add intelligence to the right person at the right time. This movement might be the driver for Business Intelligence to the next level.
Stephen Choo Quan


