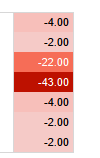
IN LESS THAN 1 SECOND, DO YOU KNOW WHAT TASK YOU SHOULD ADDRESS IN THIS LIST? That is the power of pre-attentive data visualization.
I have been looking at data in tables for a long time. I have sliced and diced tables, folded tables, and grouped them more ways than the average business person. I have always seen the output as pretty but never felt the compelled feeling of action on insight.
What is the one activity that I can take that would dramatically impact the outcome? You are not doing BI unless you positively influence the result; otherwise, you are just reporting.
I have been playing with Tableau for the last two years. I have a newfound appreciation for pre-attentive Data Visualization and its ability to zoom in on that game-changing action.
Many intelligent folks like yourself can do mental gymnastics to arrive at the answer, but time and energy spent can never be returned. We ended up working so hard on the analysis that we pat ourselves on the back and said, “good job,” and went home.
It is the only action that changes outcomes. It would be best to drive a bulldozer to move a mountain, not planning or moving the mountain. Good intentions pave the road to hell.
The way the Tableau tool addresses, Position, Color, Size, and Shape is impressive. It also addresses the nuances of direction and makes something pop with minimal effort and expertise in visualization on the user’s part.
The most successful companies are quickly sifting through data and taking action based on those insights. The best companies are doing this faster than their competitors and will continue doing so to keep the competitive advantage.
Thanks for reading and sharing ❤


[…] I value Tableau as the best for Explanatory as it has the cleanest visualization widgets and the user control over color, size and chart junk can really focus the consumers to get to the standouts be alerted. See the Power of Data Visualization […]
Comments are closed.